[free tool] How to calculate employee progression through a salary band

Skip straight to the tool ⬇️
How do salary bands relate to career progression?
The two are intrinsically linked – salary bands are the bridge between career progression and compensation.
The range of a salary band i.e. the minimum to maximum salary is largely dictated by how long you expect an employee to stay in a role before promotion – which means it’s closely tied to a company’s structure for both job levels and career progression.
A standard width for a salary band is around 15% either side of the midpoint (but some companies opt for a wider or narrower width, depending on progression structures).
And an employee will progress through that salary band with incremental pay increases as they hit key milestones for their role in terms of tenure, skill development, increase in responsibility or autonomy etc – as they edge closer to a full promotion to the next job level and salary band.
The standard width of 15% either side of the midpoint reflects typical career progression of around:
- 5-10% annual salary increase
- 3-4 years to be promoted to the next level.
Within this ‘standard’ there is, of course, variance.
For instance, the expected time to promotion is often shorter early on in an individual’s career, and becomes longer as they become more senior.
Equally, a high performing employee will likely receive higher pay increases and/or be promoted to the next job level and salary band more quickly, whereas a low performer will stay in their salary band for longer and progress through the band more slowly with smaller pay increases.
And it’s also important to note that it’s highly unusual for an employee to start out at the very minimum of their band or end up at the very maximum of the band – these reflect the absolute minimum and maximum before they are identified as a salary band outlier and there's concern about an employee's pay.
Here’s an example.
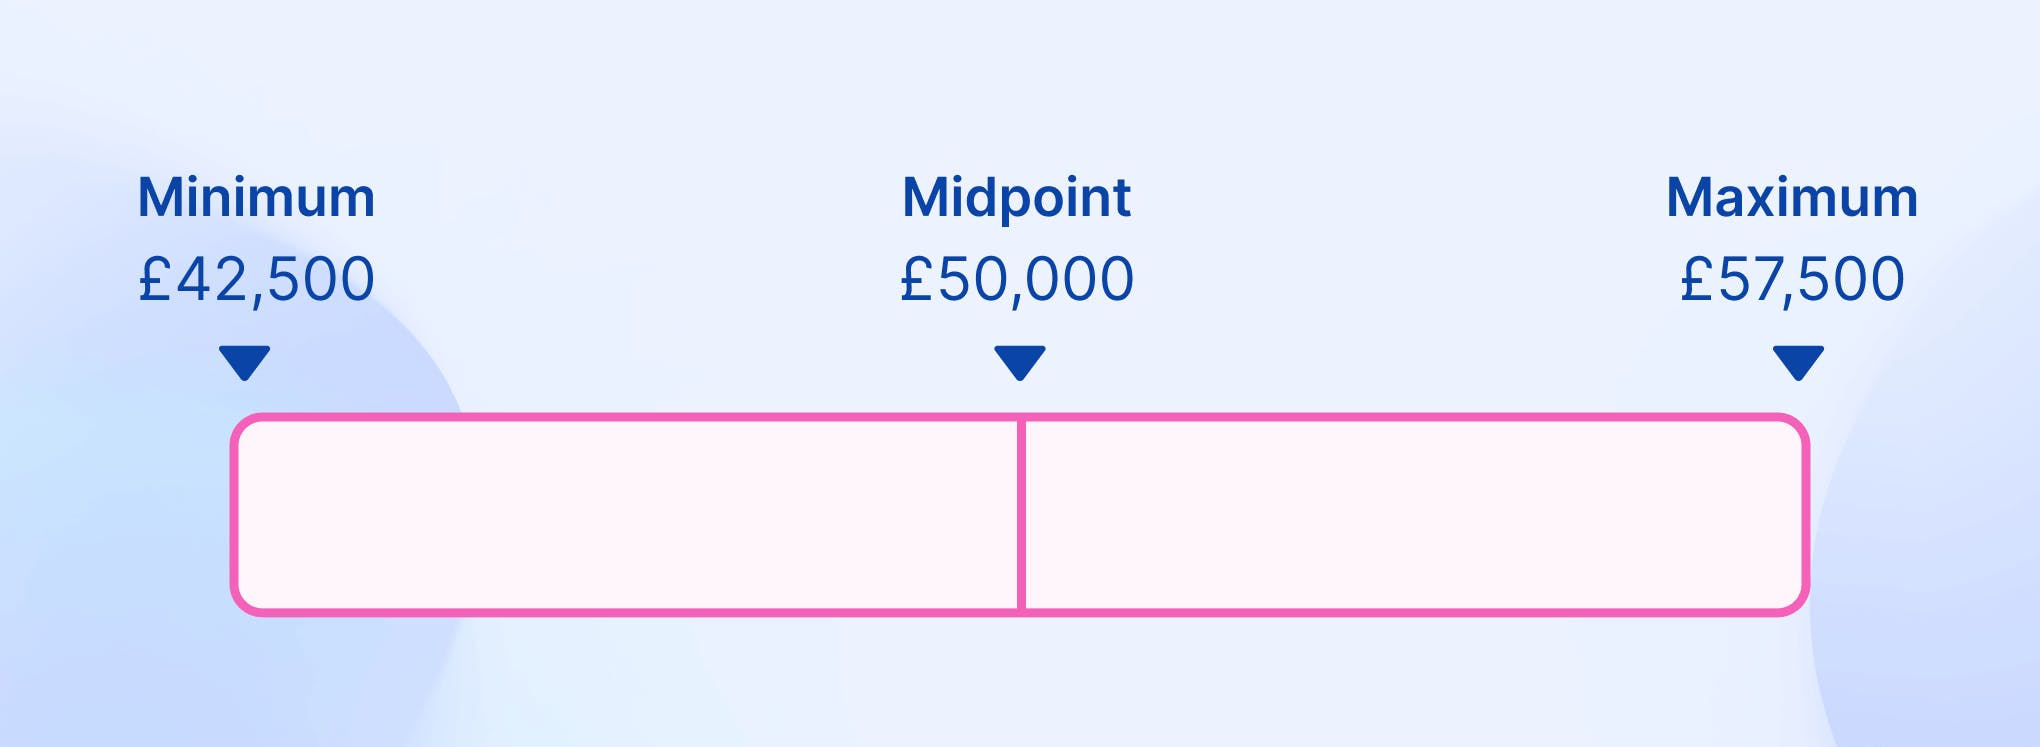
Let’s say we have a salary band for a role which ranges from £42,500 to £57,500 – that’s the standard 15% width either side of a midpoint of £50,000.
An employee is hired into the role with a starting salary of £48,500.
Evaluating how an employee’s compensation sits within their band is typically done by looking at the compa ratio (employee’s salary divided by band midpoint). In this instance, the compa ratio is 0.97 – indicating that the employee’s salary sits just below the band midpoint.
Evaluating employee compensation vs. band is typically done by looking at the compa ratio (i.e. employee’s base salary divided by the band midpoint - in this example the resulting compa ratio is 0.97).

The employee then remains in the same role for 3 years before they are promoted to the next level.
Throughout that time they receive an average annual pay increase of 5% – these continual pay increases are important to avoid employees being locked into the same salary for a long time, and then receiving a large pay increase at the point of promotion.
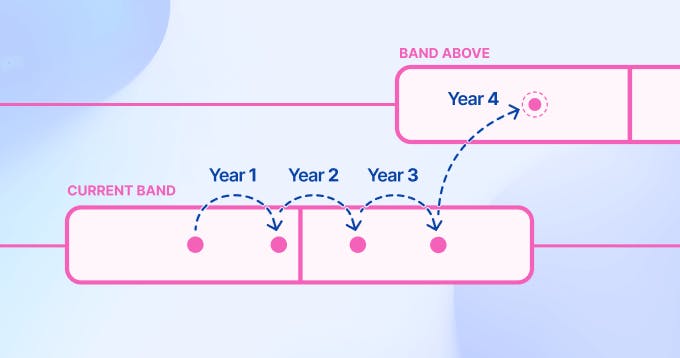
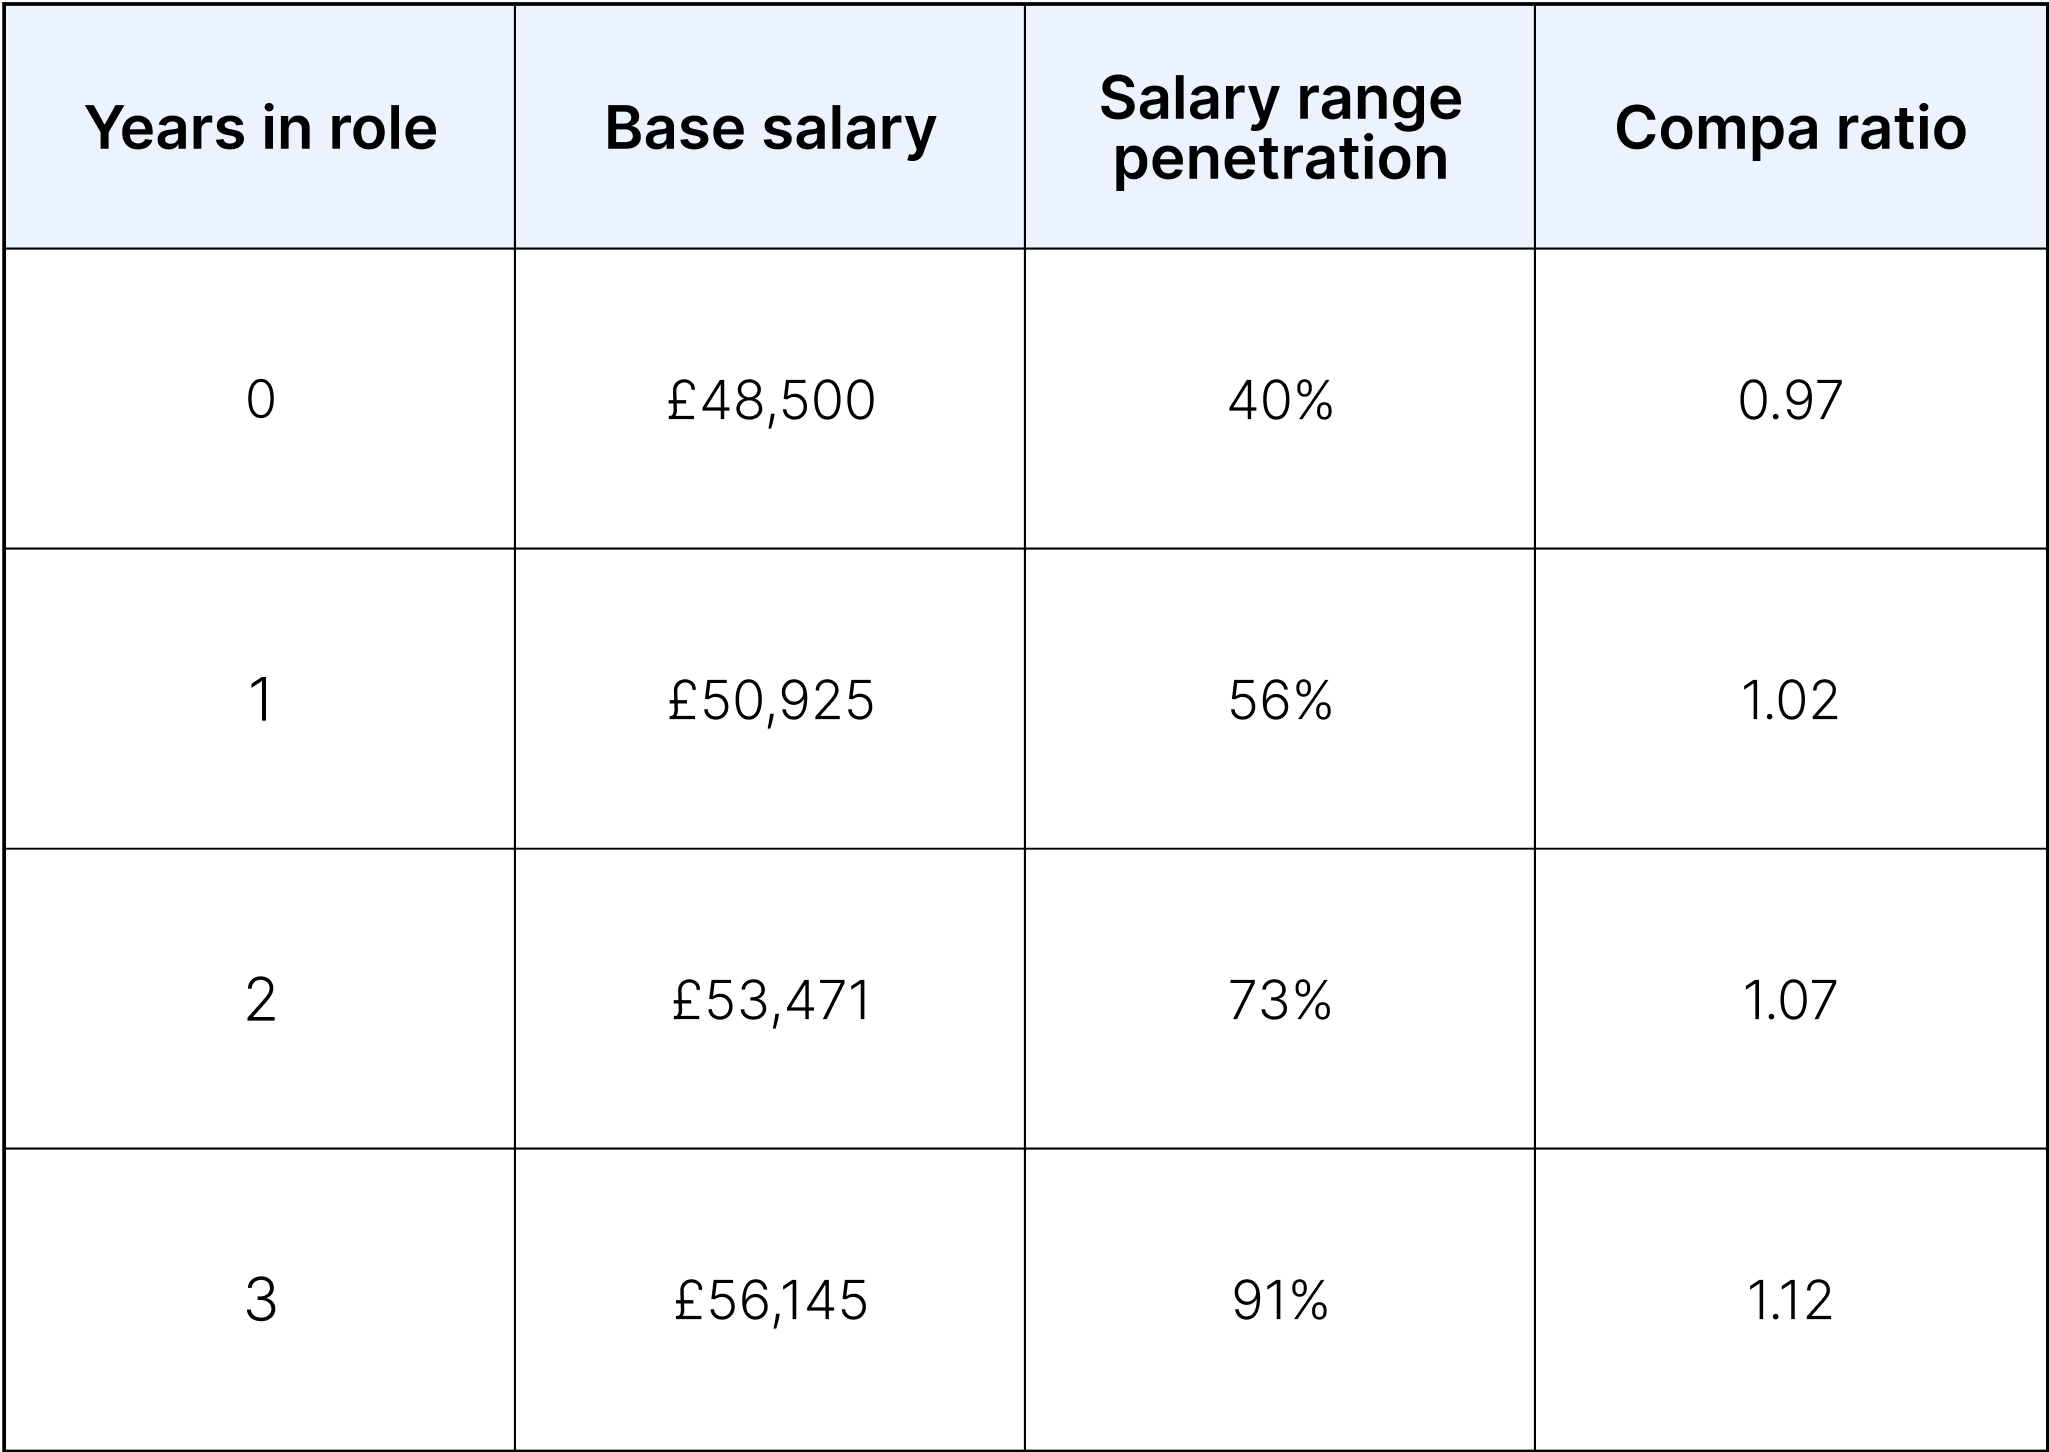
So, their pay progression within the salary band over those 3 years of the role looks like this:
And the employee has then developed sufficiently that they are promoted up to the next job level and salary band with a more significant salary increase.
Exploring different scenarios for pay progression through salary bands for your employees in this way is a useful activity when:
- Building a new salary offer, to gain confidence in how a candidate will move through the salary band for that role
- Refreshing your salary band structure, to make sure that employees are able to grow with the company, and that compensation will progress smoothly as their career develops
- Implementing pay transparency, to build confidence among employees that your salary band structure is fair and works for them.
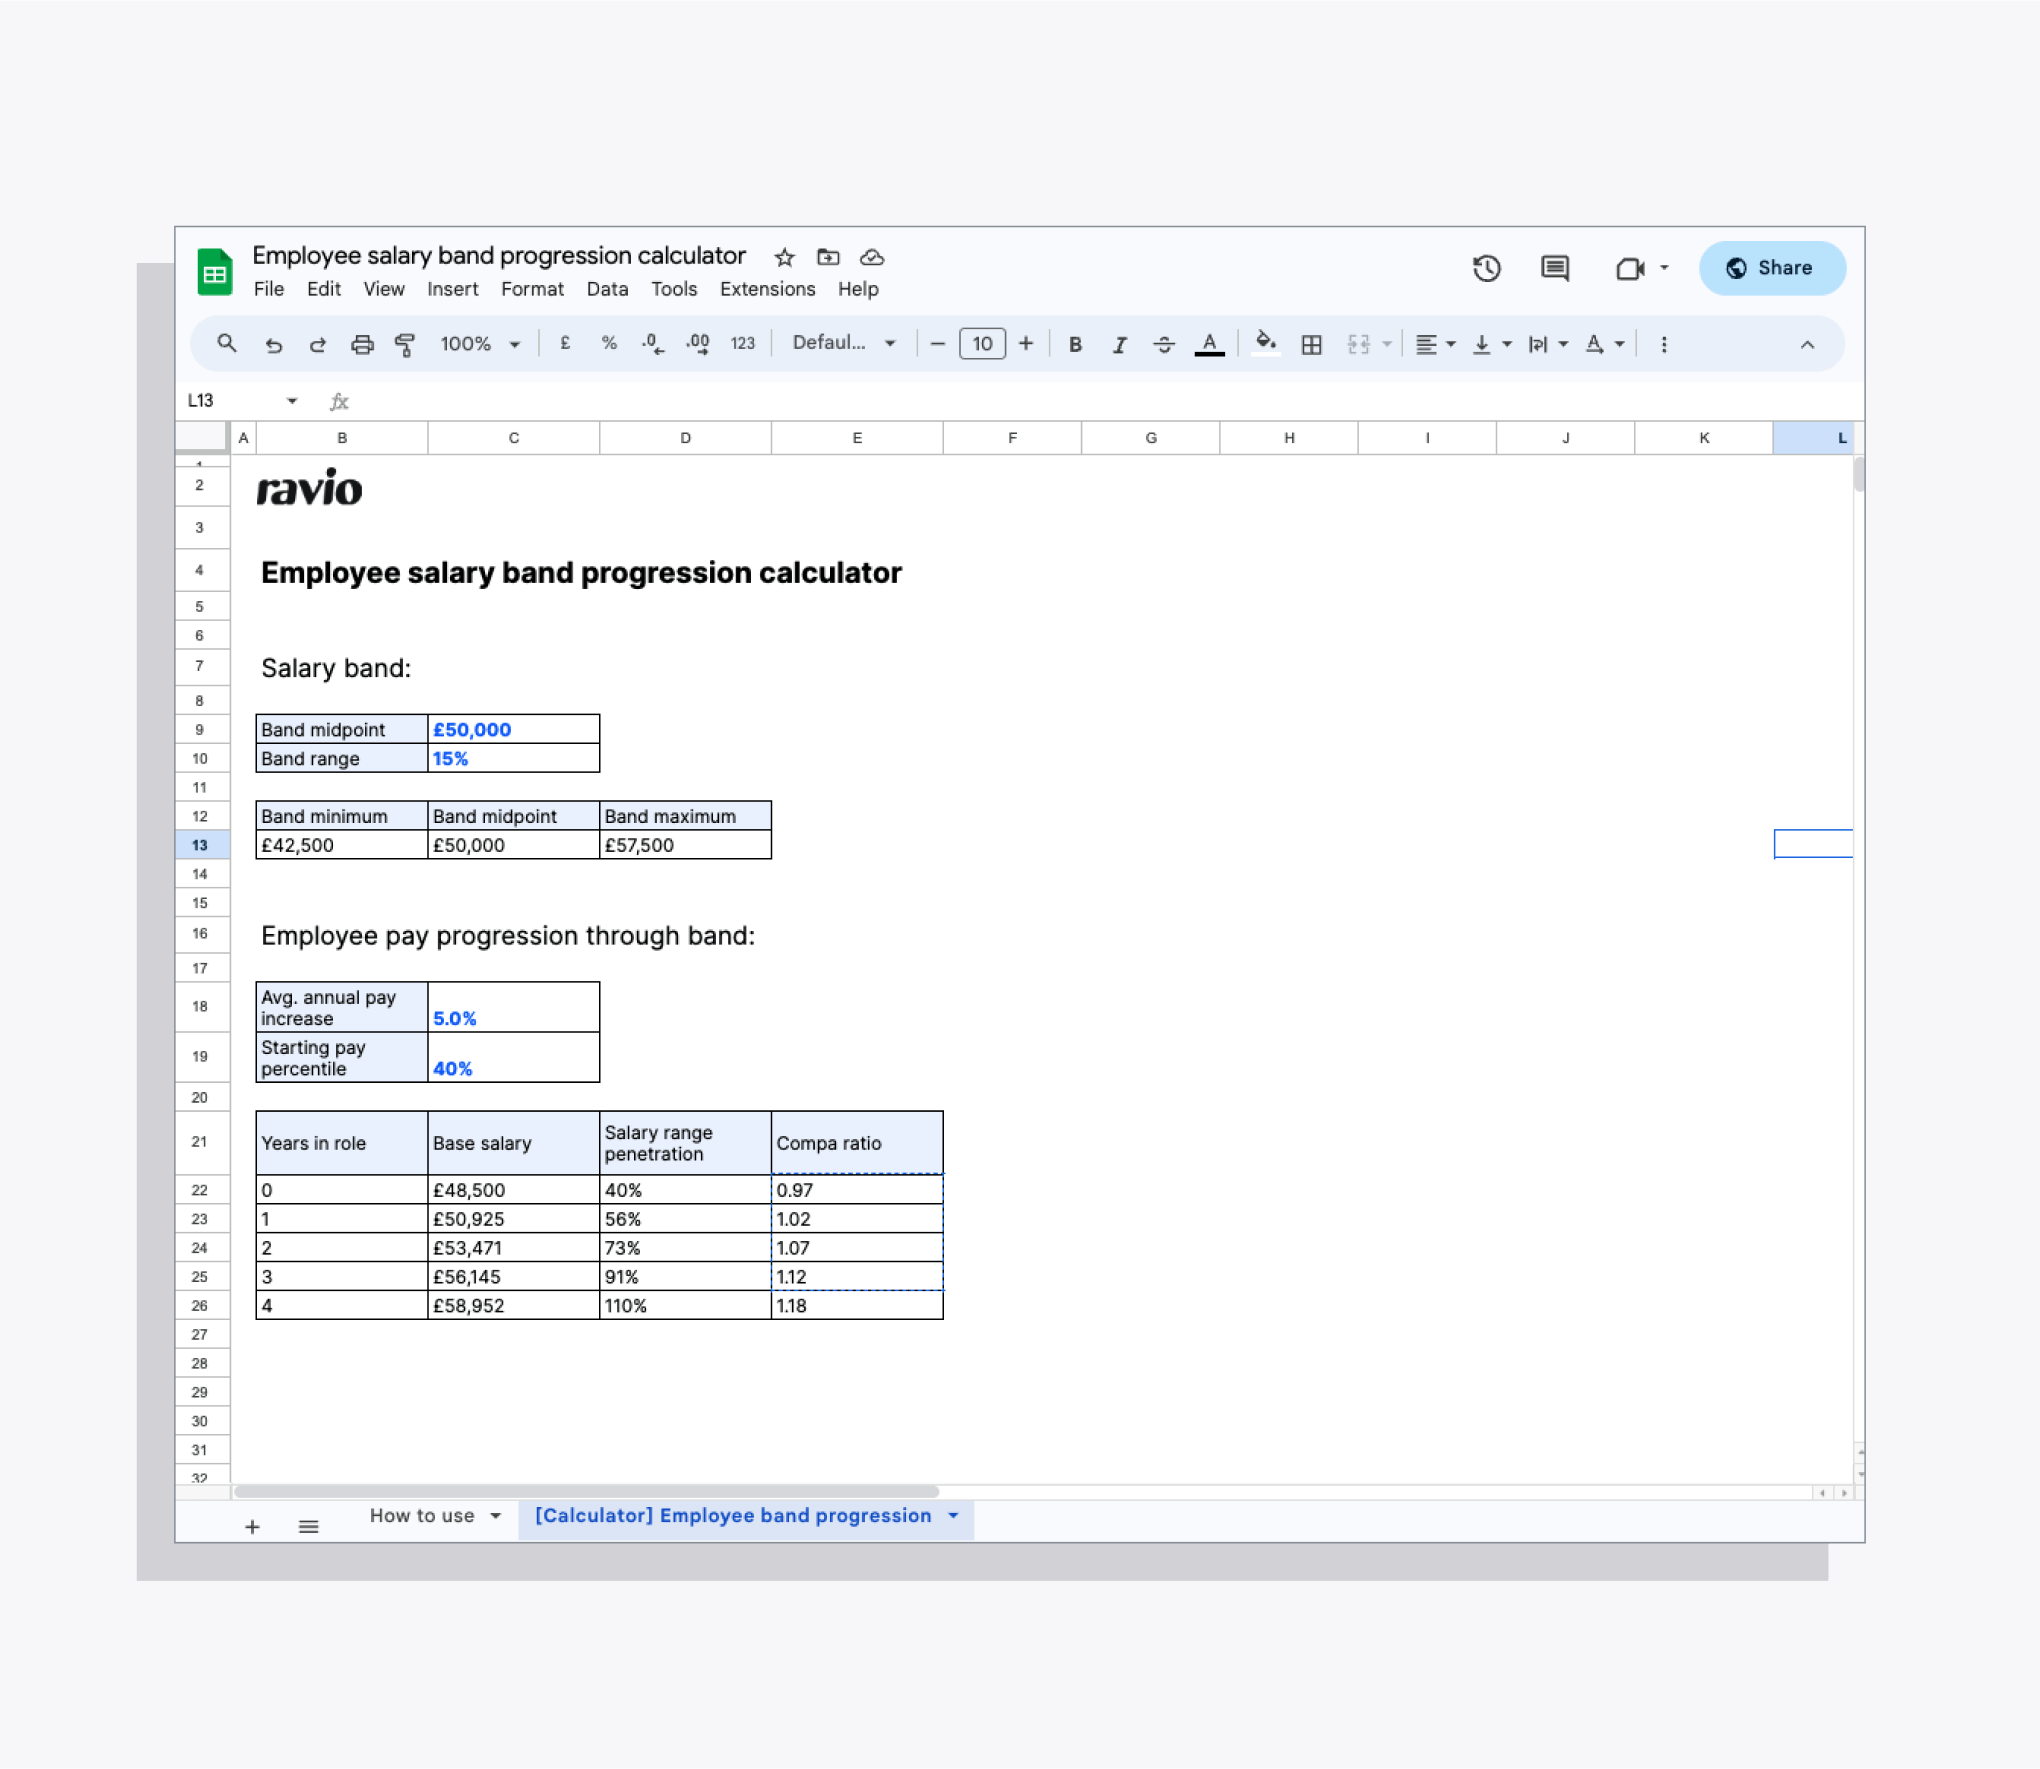
And for a simple way to do exactly that (without having to deal with the calcs yourself!), head to our employee band progression calculator.
What are the salary range penetration and compa ratio?
In the table above you’ll see both ‘salary range penetration’ and ‘compa ratio’ – these are two useful compensation metrics for understanding an employee’s progression within a salary range:
- Salary range penetration tells you where a employee’s salary falls within their salary band i.e. how far they have progressed through the band
- Compa ratio is a comparison of an employee’s salary to the midpoint of the salary band.
Calculating an employee’s salary range penetration
Salary range penetration = (actual salary - minimum salary) ÷ (maximum salary - minimum salary)
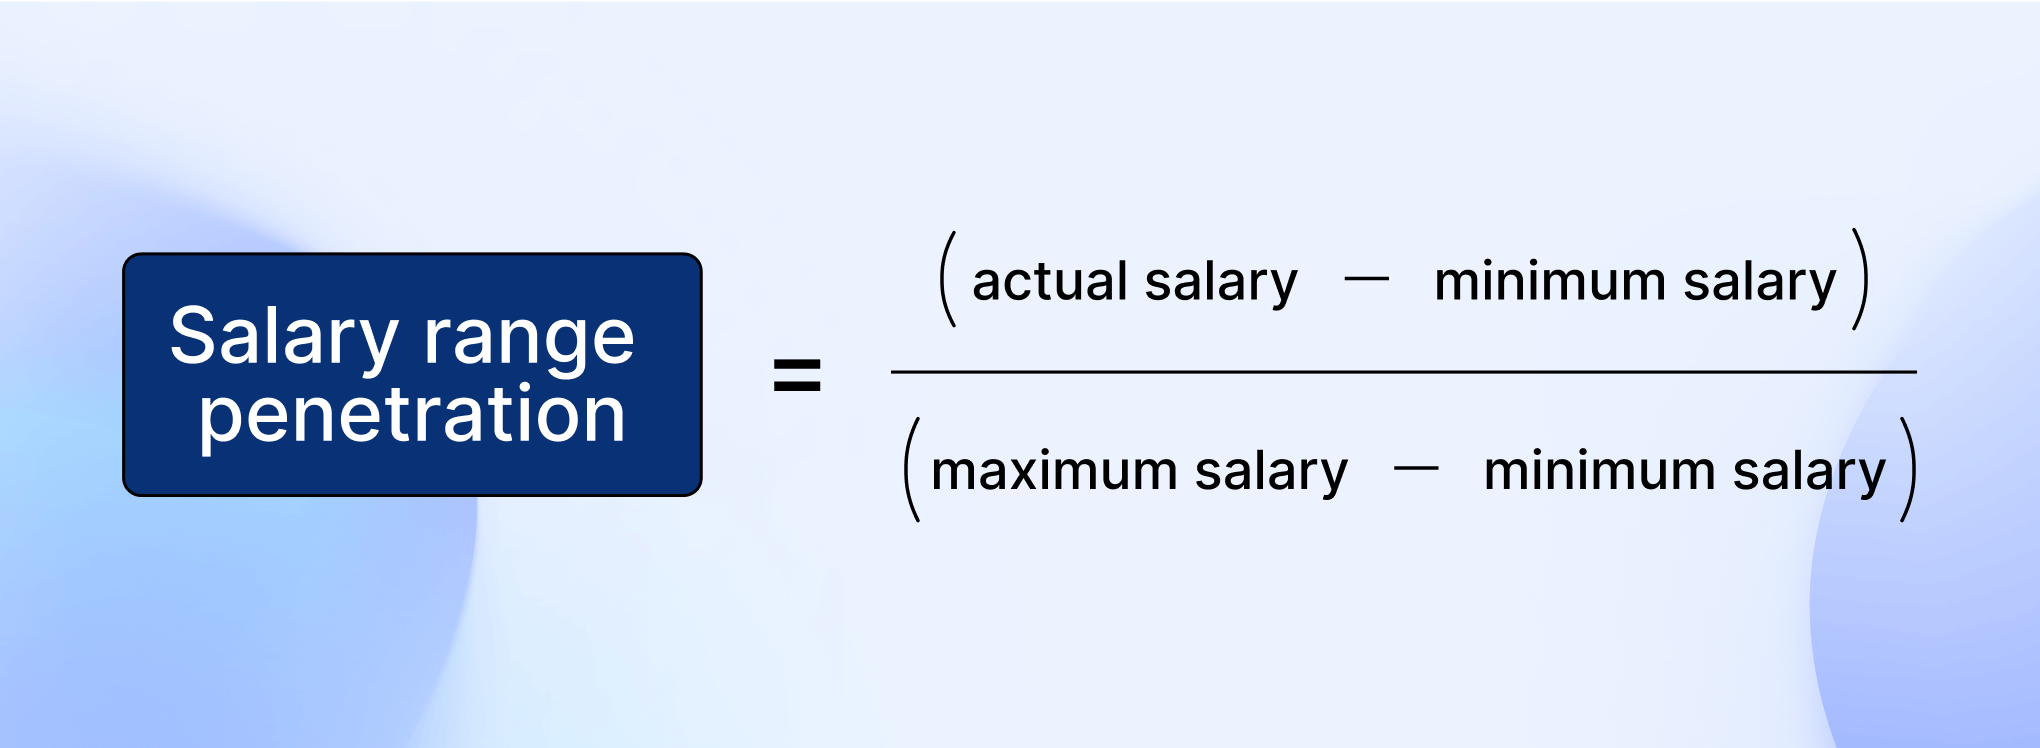
So, for the year 1 instance given in the table, that would be:
(£50,925 - £42,500) ÷ (£57,500 - £42,500)
Which gives:
£8,425 ÷ £15,000 = 0.56
i.e. a salary range penetration of 56% of the way through the band.
Calculating an employee’s compa ratio
The compa ratio is calculated by taking an employee’s current salary and dividing it by the midpoint of the salary band for their role, so:
Compa ratio = actual salary ÷ salary band midpoint
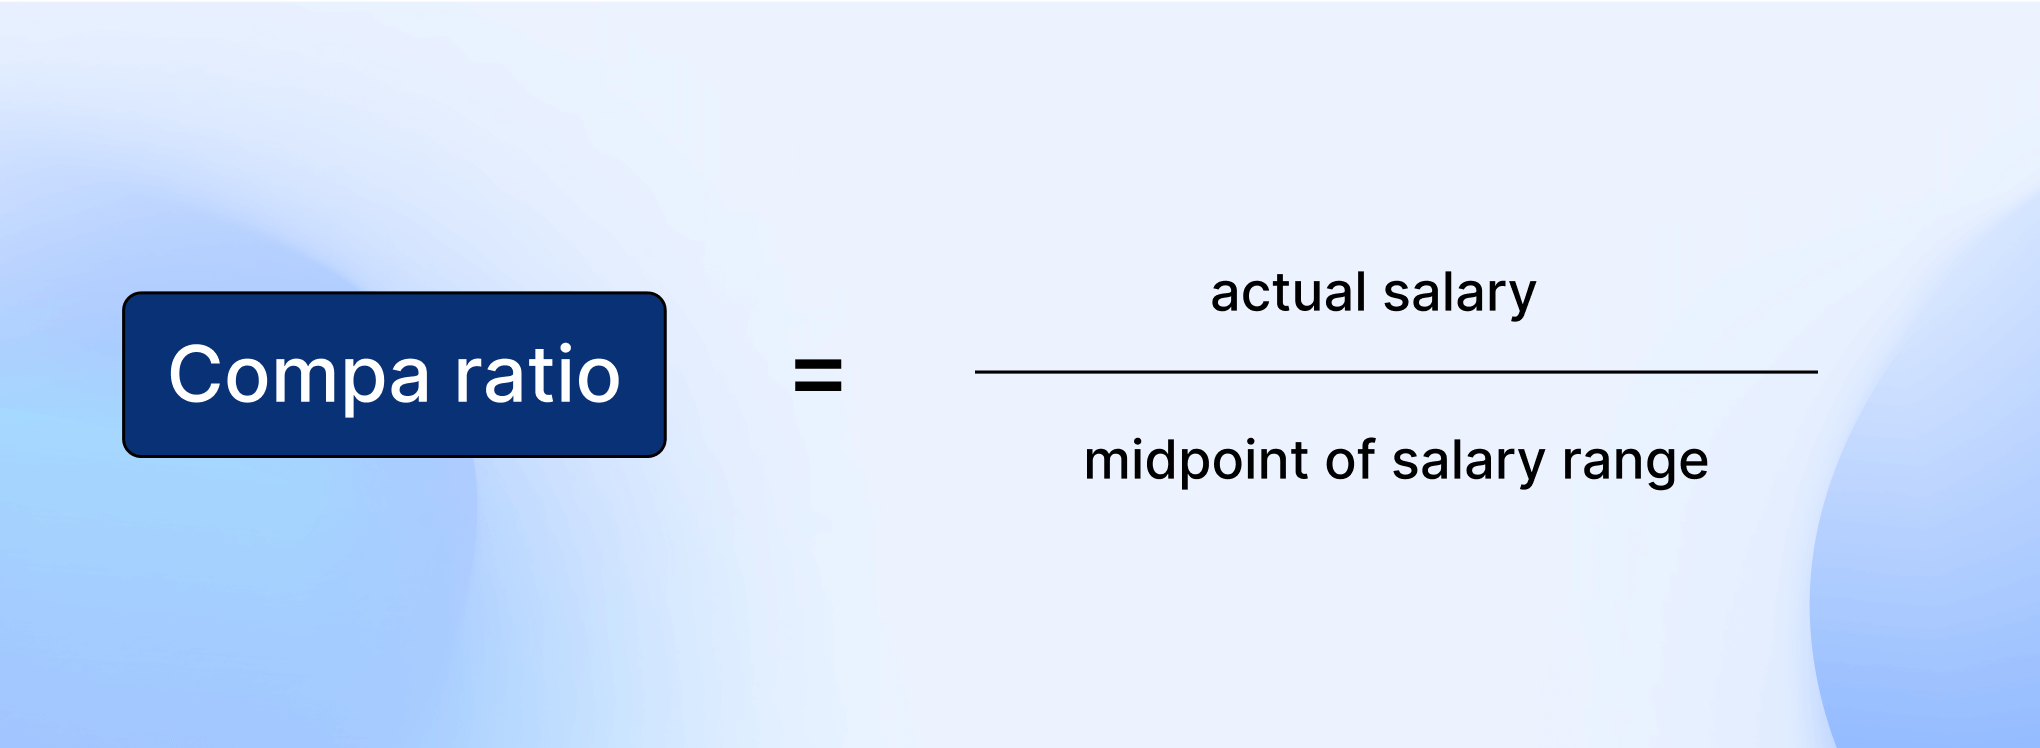
If the resulting ratio is 1.0, the salary is exactly at the midpoint of the range. Anything less than 1.0 means the salary is below the salary midpoint, and above 1.0 means it is above.
So, for the year 1 instance given in the table, that would be:
£50,925 ÷ £50,000 = 1.02 or 102%
Which indicates that the salary the employee was hired with is just below the midpoint – generally speaking it’s best practice to keep an employee’s compa ratio between a minimum of 0.8 or 80% and 1.2 or 120%.
The compa ratio is particularly useful for compensation fairness and internal pay equity – in a best practice salary band structure, the salary band midpoint is the same as the target percentile you’ve set for the role in your compensation philosophy, so seeing how an individual’s salary compares to the midpoint highlights if you are under or over paying employees.
If the resulting ratio is 1.0, the salary is exactly at the midpoint of the range. Anything less than 1.0 means the salary is below the salary midpoint, and above 1.0 means it is above.